Funded Trader Leaderboard: What It Tracks, Why It Matters, and How Prop Firms Use Rankings
A funded trader leaderboard is a public ranking of traders based on their performance inside a prop firm. It shows who is generating returns, how much they are making, and how they compare against other funded participants.
A funded trader leaderboard is a public ranking of traders based on their performance inside a prop firm. It shows who is generating returns, how much they are making, and how they compare against other funded participants.
For traders, leaderboards serve as proof of concept. They show that real people are passing evaluations, receiving funded accounts, and withdrawing profits. For the firm, leaderboards build credibility and attract new participants.
But not all leaderboards are built the same. Some display verified results tied to live accounts. Others show demo performance with no connection to actual payouts. The difference matters.
This guide covers how funded trader leaderboards work, what metrics to look for, how PropFunding displays trader rankings, and how to use leaderboard data to improve your own trading.
What Is a Funded Trader Leaderboard
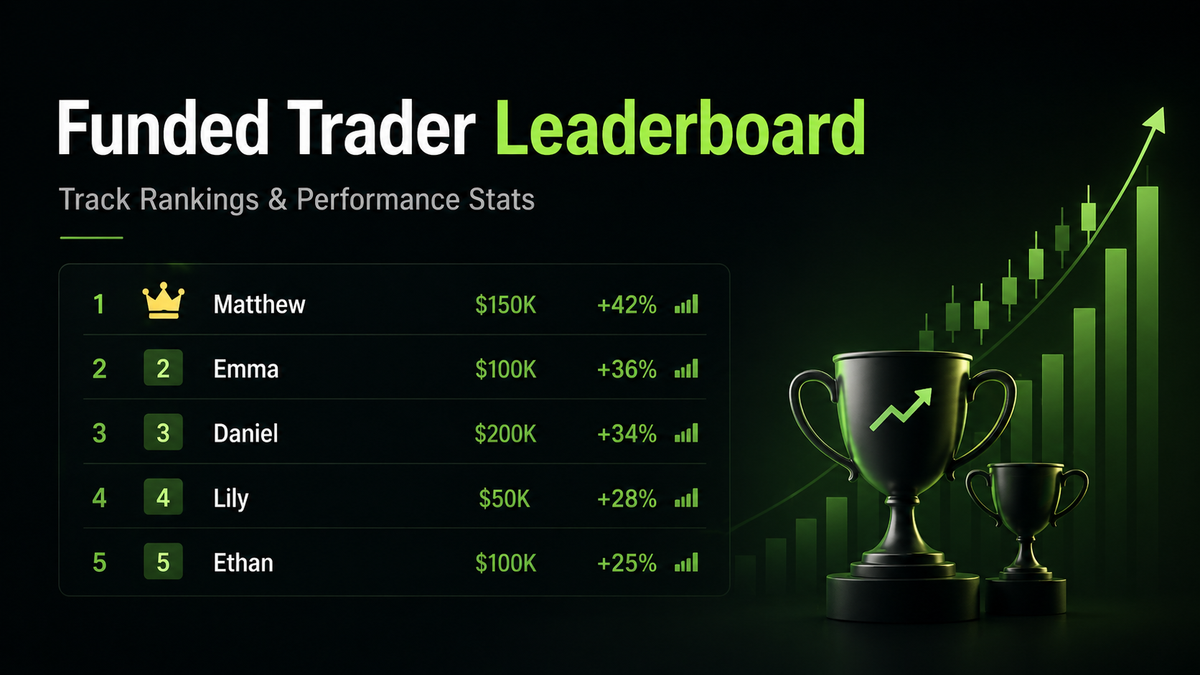
A funded trader leaderboard is a ranking system that displays the performance of traders who have passed a prop firm evaluation and are actively trading funded accounts.
The leaderboard typically shows metrics like total profit, percentage return, number of trades, and account size. Some firms include additional data points such as drawdown history, win rate, or trading duration.
The purpose is transparency. A firm that publishes real trader results signals that its funding model works and that traders are receiving payouts.
Why Funded Trader Leaderboards Matter
Leaderboards are not just for bragging rights. They serve several practical functions for both traders and firms.
Proof That Traders Get Paid
The most important function of a leaderboard is to show that traders are passing evaluations and receiving real payouts. A firm that claims to fund traders but cannot show any ranked, verified results raises questions.
When evaluating a prop firm, check whether the leaderboard shows data tied to funded accounts or demo accounts. Demo leaderboards prove nothing about the firm's payout reliability.
Benchmark for Your Own Performance
A leaderboard gives you a reference point. If the top traders on a platform are generating 5% to 8% monthly returns with drawdowns under 3%, you can compare your own results against that standard.
This is more useful than comparing yourself to retail trader statistics, which include traders with no risk management and no structured rules. Prop firm leaderboards filter for traders operating within defined limits.
Insight Into What Works
Leaderboard data often reveals patterns. If the top-ranked traders consistently hold positions for 1 to 4 hours, trade during the London-New York overlap, and focus on two or three pairs, that tells you something about what strategies succeed under the firm's rules.
You cannot copy a leaderboard trader's exact strategy from the rankings alone, but you can identify patterns in the data that inform your own approach.
Accountability for the Firm
A live leaderboard creates accountability. If a firm claims to have funded 500 traders but the leaderboard shows 12 active accounts, the numbers do not match. Public data makes it harder for firms to overstate their track record.
What Metrics a Funded Trader Leaderboard Should Display
Not all leaderboards show the same information. Here is what to look for when evaluating a leaderboard's quality.
Total Profit
The total dollar or percentage profit generated by the trader on their funded account. This is the headline number, but should not be viewed in isolation. A trader who made $5,000 with a 5.8% maximum drawdown is performing differently from one who made $5,000 with a 0.5% drawdown remaining before breach.
Percentage Return
Profit expressed as a percentage of the account size. This normalizes results across different account tiers. A 6% return on a $25K account and a 6% return on a $100K account reflect similar skill, even though the dollar amounts differ.
Account Size
The capital allocated to the trader. Larger accounts generally indicate more experience or successful scaling. Some leaderboards rank traders across all account sizes together, while others segment by tier.
Drawdown
Current or maximum drawdown during the funded period. This shows how much risk the trader has taken relative to their allowed limits. Low drawdown with positive returns indicates controlled, consistent trading.
Number of Trades
Total trades placed during the funded period. Combined with profit data, this shows whether the trader is generating returns from many small trades or fewer larger positions.
Trading Duration
How long the trader has held their funded account. A trader who has been funded for 6 months with steady returns is a different profile than one who was funded for 2 weeks and hit a large gain on a single trade.
Payout History
Some leaderboards include payout amounts or payout counts. This is the strongest proof that the firm is paying traders. A leaderboard with payout data attached to ranked traders is more credible than one showing only account balance.
How PropFunding's Leaderboard Works
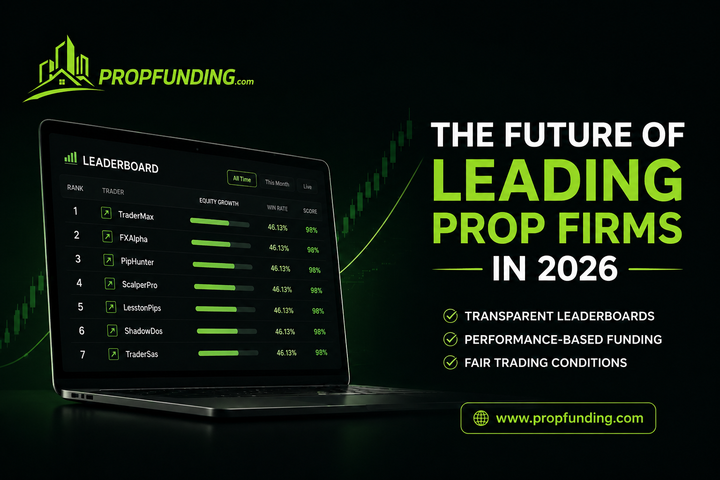
PropFunding publishes a live leaderboard at propfunding.com/leaderboard. The leaderboard ranks traders based on their performance during the evaluation and funded stages.
What the Leaderboard Shows
The PropFunding leaderboard displays trader rankings with performance data visible to all visitors. This includes metrics from active challenges and funded accounts, giving prospective traders a view into how current participants are performing.
Stats Page
In addition to the leaderboard, PropFunding maintains a stats page at propfunding.com/stats. This page shows aggregate data across the platform, giving traders a broader view of how the community is performing as a whole.
How This Connects to the Cohort Model
PropFunding funds 10% of traders per monthly cohort. The leaderboard plays a role in this system because it tracks which traders are meeting the evaluation criteria. Traders who pass but fall outside the top 10% are rolled into the next month at no additional cost.
This means the leaderboard position is not just for display. It has a direct impact on when a trader receives their funded account.
Community Copy Access
PropFunding also provides funded traders with access to anonymized trading data from top performers. This is not a copy trading service. It is a data layer that shows aggregate patterns from the highest-ranked traders, giving other participants insight into what strategies and behaviors are producing results.
How to Use Leaderboard Data to Improve Your Trading
A leaderboard is a data source. Here is how to extract useful information from it.
Study the Top Performers
Look at the traders consistently ranked at the top. Note their percentage returns, number of trades, and how long they have been funded. If the top 10 traders all show moderate, consistent returns rather than large spikes, that tells you the firm rewards consistency over aggression.
Compare Your Metrics
If you are currently in an evaluation or tracking your demo results, compare your key metrics against the leaderboard. Are your returns in the same range as funded traders? Is your drawdown lower or higher? Is your trade frequency similar?
This comparison gives you a realistic sense of where you stand before committing to an evaluation.
Identify Common Patterns
Look for patterns in the data. Do top traders tend to place fewer trades? Do they hold positions longer? Are certain return ranges more common than others? These patterns can help you adjust your strategy before entering or during the evaluation.
Track Changes Over Time
Check the leaderboard regularly. If the same traders appear at the top month after month, it signals that the firm is retaining funded traders and that the rules support long-term trading. If the leaderboard churns constantly with new names, it may mean funded accounts are being closed quickly.
What to Watch Out for in Prop Firm Leaderboards
Not all leaderboards are trustworthy. Here are the warning signs.
Demo-Only Results
A leaderboard that shows demo account performance does not prove anything about funded trading or payouts. Check whether the leaderboard explicitly states that results are from funded accounts.
No Payout Data
If the leaderboard shows large profits but no payout history, there is no proof that traders are withdrawing money. Profits on a screen and profits in a bank account are different things.
Manipulated Rankings
Some firms highlight only their best traders and hide accounts that failed or were closed. A credible leaderboard shows a range of results, including traders with modest returns, not just top performers.
Unverified Data
If the leaderboard data is self-reported or not tied to verified trading accounts, it cannot be trusted. Look for leaderboards connected to live trading platforms like MT5, where results can be independently verified.
How PropFunding's Leaderboard Compares
Common Questions About Funded Trader Leaderboards
What is a funded trader leaderboard? A funded trader leaderboard is a public ranking of traders who have passed a prop firm evaluation and are trading on funded accounts. It typically shows metrics like profit, return percentage, drawdown, and trade count.
Does PropFunding have a leaderboard? Yes. PropFunding publishes a live leaderboard at propfunding.com/leaderboard and an aggregate stats page at propfunding.com/stats.
Can I see payout data on leaderboards? Some firms include payout information on their leaderboards. PropFunding's stats page provides aggregate community data. For individual payout verification, check whether the firm offers withdrawal certificates or public payout records.
Does leaderboard ranking affect funding at PropFunding? Yes. PropFunding funds 10% of traders per monthly cohort. Performance during the evaluation determines who gets funded in each cycle. Traders who pass but miss the cap are rolled into the next month at no cost.
How can I use leaderboard data to improve? Compare your trading metrics against the top performers on the leaderboard. Look at their return ranges, drawdown levels, trade frequency, and how long they have been funded. Use these benchmarks to adjust your strategy.
Is PropFunding's evaluation free? Yes. The evaluation is free to enter. Traders only pay an activation fee ($125 for a $10K account or $249 for a $25K account) after passing.